OrientationJ
OrientationJ is open-source software for the directional analysis of 2D images: a series of Java plugins, easy to install on ImageJ and Fiji, free under the GPL-3.0 licence — how to cite. It relies on the gradient structure tensor, evaluated over a small window at every pixel, from which it computes the directional features that say how the local structure is organized: its orientation, the coherency telling whether that orientation is well defined, and how anisotropic the neighborhood is. One parameter controls the measurement, the analysis scale σ, the size of that window.
OrientationJ holds several plugins: Analysis for the feature maps and the color survey, Distribution for the angular histogram, Vector Field for the overlay, and MonogenicJ for a multiresolution analysis. Every command runs from a dialog and from an ImageJ macro. In addition, 16 test images come with the documentation, together with the assessments built on them: the angular distribution against other tools, the accuracy of the five gradients, and two Python implementations of the same tensor — a faithful port and a minimal operator.
Applications
Fibers, filaments, fringes, cracks, fractures, flows, growth rings: many scientific images are made of elongated structures, and what matters about them is their direction. OrientationJ quantifies that direction everywhere in the image, and more than 300 published studies have used it to do so — from the actin cytoskeleton to nanofibers and bone.
In 3D, with OrientationPy
OrientationJ measures orientation in 2D images only. For volumes, the EPFL Center for Imaging develops OrientationPy, its Python successor: the same gradient structure tensor, in 2D and in 3D, usable as a library or through its napari plugin.
OrientationPy — orientation in 2D and 3D
Example of analysis scale
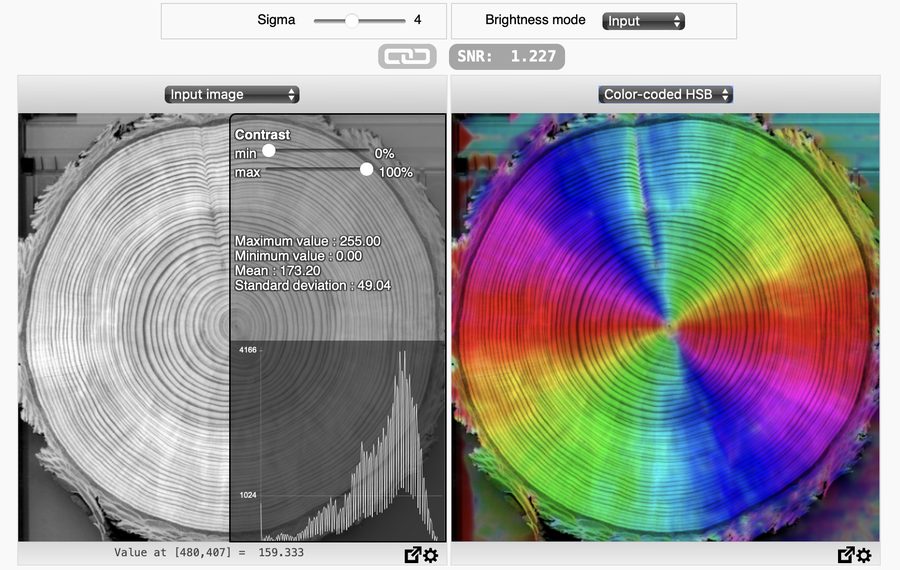
The same measurement, run at a growing analysis scale σ on the classic Tree Rings sample: small windows follow every detail, large ones summarize the trend (macro).

Demonstration in the browser
The interactive online demo runs the analysis in the browser, without installing anything, on the samples provided or on your own image: move the σ slider and the color survey follows.
Color survey
Drag the handle below: on the left the collagen fibers as they were acquired, on the right the same field as a color survey. How that image is built, and how to read it, is on the Color Survey HSB page.
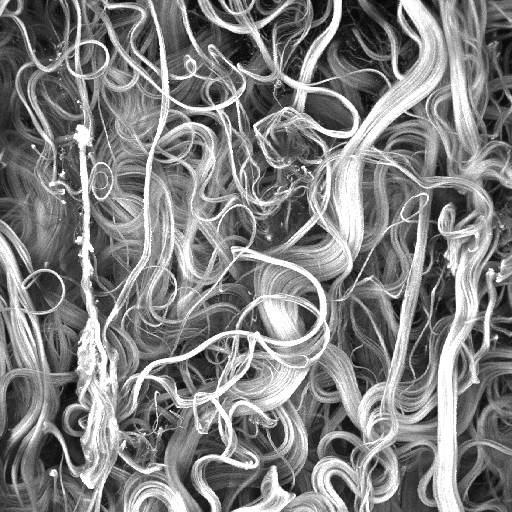
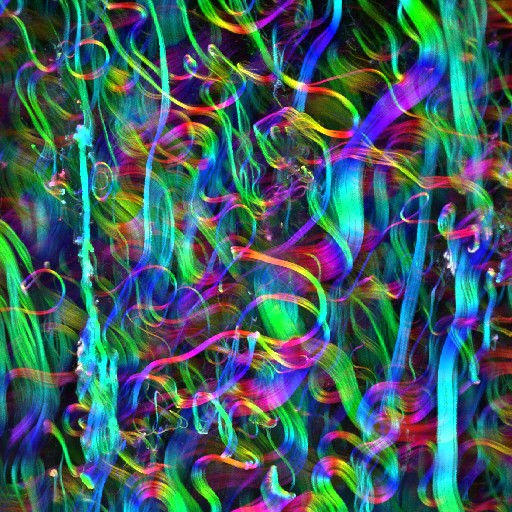
Drag the handle: collagen fibers on the left, the same field as a color survey on the right
hue gives the orientation, saturation the coherency.